


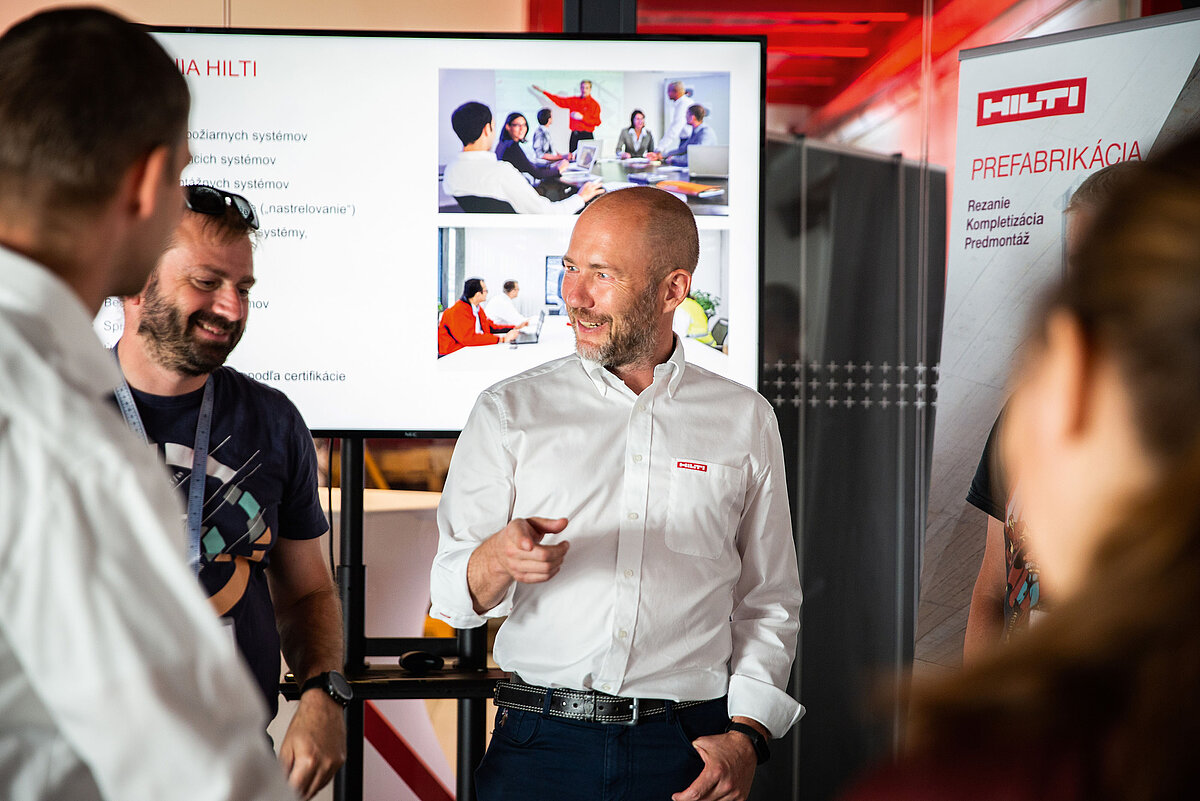


Strong Growth in a Challenging Environment
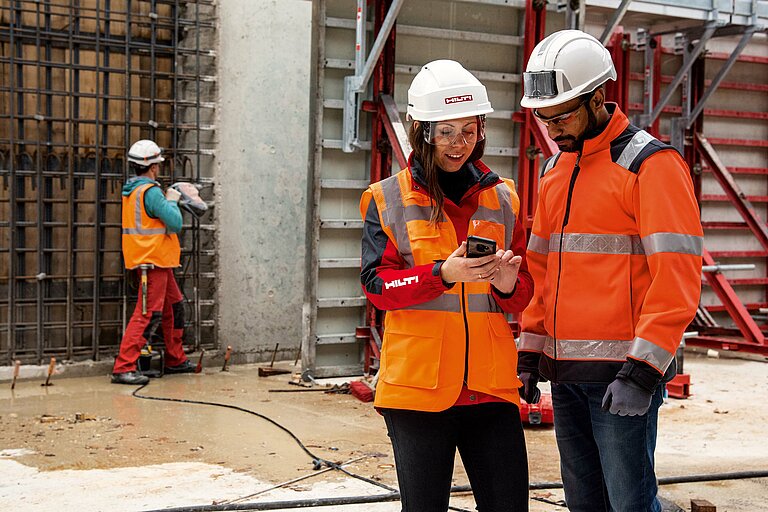
With sales growth of 9.0 percent in local currencies (2.7 percent in Swiss francs), the Hilti Group closed 2023 with turnover of more than CHF 6.5 billion. With this result, Hilti outperformed the market. Once more, the appreciation of the Swiss franc led to a significantly negative currency impact of 6.3 percentage points on sales. Nevertheless, the operating result grew at a considerably stronger rate, by 5.3 percent, and reached CHF 770 million. Despite economic and geopolitical uncertainties, Hilti significantly invested in its sales capacity, innovation and long-term projects within the corporate strategy Lead 2030.

Despite economic and geopolitical uncertainties, Hilti significantly invested into its sales capacity, innovation and long-term projects of the corporate strategy Lead 2030.
Felix Hess, Member of the Executive Board
HIGHLIGHTS 2023
6,520
Net sales in CHF mill.
With sales growth of 9.0 percent in local currencies (2.7 percent in Swiss francs), the Hilti Group closed 2023 with turnover of more than CHF 6.5 billion.
359Free cash flow in CHF mill.
Free cash flow bounced back to CHF 359 million from negative CHF 147 million in 2022.
560Net income in CHF mill.
Net income decreased by 0.9 percent to CHF 560 million, due to the significantly negative currency impact and a normalization of the Group tax rate.
At a regional level, Europe managed to close the year with sales growth of 8.7 percent in local currencies, primarily driven by the strong contribution from Southern Europe. The Americas region grew by 9.1 percent, while Asia/Pacific was at 13.8 percent. China recovered slowly from COVID-19 lockdowns, while the rest of the region achieved solid growth rates. The ongoing war in Ukraine had an impact on the entire Eastern Europe / Middle East / Africa region, resulting in growth of 3.1 percent.
Financial Information
Key Figures
| financial amounts in CHF million | ||
| 2022 | 2023 | |
| Results | ||
| Net sales | 6,347 | 6,520 |
| Depreciation and amortization | (440) | (476) |
| Operating result | 731 | 770 |
| Net income before tax | 668 | 700 |
| Net income | 565 | 560 |
| Return on capital employed (ROCE) in % (operating result)1 | 13.2 | 13.3 |
| Return on equity (ROE) in % (net income) | 12.7 | 12.2 |
| Return on sales (ROS) in % | 11.5 | 11.8 |
| Free cash flow2 | (147) | 359 |
| Balance sheet | ||
| 2022 | 2023 | |
| Total equity | 4,579 | 4,576 |
| Total equity in % of total equity and liabilities | 62 | 59 |
| Total non-current liabilities | 1,130 | 1,484 |
| Total current liabilities | 1,717 | 1,644 |
| Capital expenditures on intangible assets and on property, plant and equipment | 445 | 451 |
| Intangible assets and property, plant and equipment | 2,350 | 2,728 |
| Other non-current assets | 1,551 | 1,751 |
| Total current assets | 3,525 | 3,225 |
| Total assets | 7,426 | 7,704 |
| Dividend3 | 281 | 279 |
| Employees (as at December 31) | 32,487 | 34,111 |
| 1 Capital employed is defined as the average of the total equity and interest-bearing liabilities of the last two years | ||
| 2 In 2021, the Group decided to change the definition of free cash flow, excluding the cash flow from financial investments and disclosing it as a separate line item. Prior period figures were restated accordingly | ||
| 3 As proposed by the Board of Directors | ||
Consolidated Income Statement
| in CHF million | ||
| 2022 | 2023 | |
| Net sales | 6,347 | 6,520 |
| Other operating income | 184 | 207 |
| Total operating income | 6,531 | 6,727 |
| Material costs | (1,767) | (1,720) |
| Personnel expenses | (2,710) | (2,852) |
| Depreciation and amortization | (440) | (476) |
| Losses on trade and other receivables | (39) | (47) |
| Other operating expenses | (1,052) | (1,083) |
| Capitalized costs | 208 | 221 |
| Total operating expenses | (5,800) | (5,957) |
| Operating result | 731 | 770 |
| Other income and expenses (net) | (12) | (32) |
| Finance costs | (51) | (38) |
| Net income before income tax expenses | 668 | 700 |
| Income tax expenses | (103) | (140) |
| Net income | 565 | 560 |
| Attributable to: | ||
| Equity holders of the parent | 561 | 557 |
| Non-controlling interests | 4 | 3 |
Consolidated Statement of Comprehensive Income
| in CHF million | ||
| 2022 | 2023 | |
| Net income | 565 | 560 |
| Net movement on cash flow hedges, net of taxes | (4) | (1) |
| Foreign currency translation differences, net of taxes | (91) | (201) |
| Items that may be subsequently reclassified to the income statement | (95) | (202) |
| Remeasurements on employee benefits, net of taxes | 152 | (80) |
| Items that will never be reclassified to the income statement | 152 | (80) |
| Other comprehensive income (OCI) | 57 | (282) |
| Total comprehensive income | 622 | 278 |
| Attributable to: | ||
| Equity holders of the parent | 618 | 277 |
| Non-controlling interests | 4 | 1 |
Consolidated Balance Sheet
| Assets | ||
| in CHF million | ||
| 2022 | 2023 | |
| Property, plant and equipment | 1,066 | 1,115 |
| Right of use assets | 418 | 438 |
| Intangible assets | 1,284 | 1,613 |
| Deferred income tax assets | 185 | 175 |
| Other financial assets | 22 | 28 |
| Other assets | 5 | 5 |
| Trade and other receivables | 921 | 1,105 |
| Total non-current assets | 3,901 | 4,479 |
| Inventories | 959 | 778 |
| Trade and other receivables | 1,371 | 1,408 |
| Accrued income and prepaid expenses | 117 | 107 |
| Other financial assets | 87 | 46 |
| Cash and cash equivalents | 991 | 886 |
| Total current assets | 3,525 | 3,225 |
| Total assets | 7,426 | 7,704 |
| Equity and liabilities | ||
| in CHF million | ||
| 2022 | 2023 | |
| Non-controlling interests | 14 | 15 |
| Equity attributable to equity holders of the parent | 4,565 | 4,561 |
| Total equity | 4,579 | 4,576 |
| Employee benefits | 162 | 238 |
| Deferred income tax liabilities | 198 | 245 |
| Trade and other payables | 27 | 22 |
| Other financial liabilities | 704 | 930 |
| Other liabilities | 39 | 49 |
| Total non-current liabilities | 1,130 | 1,484 |
| Employee benefits | 16 | 28 |
| Trade and other payables | 661 | 630 |
| Accrued expenses | 536 | 561 |
| Other financial liabilities | 436 | 339 |
| Other liabilities | 68 | 86 |
| Total current liabilities | 1,717 | 1,644 |
| Total liabilities | 2,847 | 3,128 |
| Total equity and liabilities | 7,426 | 7,704 |
Consolidated Statement of Changes in Equity
| in CHF million | ||||||||
| Share capital | Capital reserves | Translation reserves | Hedging reserves | Retained earnings | Equity attributable to equity holders of the parent | Non-controlling interests | Total equity | |
| Equity at January 1, 2023 | 127 | 17 | (669) | 2 | 5,088 | 4,565 | 14 | 4,579 |
| Net income recognized in income statement | – | – | – | – | 557 | 557 | 3 | 560 |
| Other comprehensive income | ||||||||
| Cash flow hedges | – | – | – | (1) | – | (1) | – | (1) |
| Remeasurements on employee benefits | – | – | – | – | (80) | (80) | – | (80) |
| Foreign currency translation differences | – | – | (199) | – | – | (199) | (2) | (201) |
| Total other comprehensive income | – | – | (199) | (1) | (80) | (280) | (2) | (282) |
| Total comprehensive income | – | – | (199) | (1) | 477 | 277 | 1 | 278 |
| Dividend paid | – | – | – | – | (281) | (281) | – | (281) |
| Equity at December 31, 2023 | 127 | 17 | (868) | 1 | 5,284 | 4,561 | 15 | 4,576 |
| Equity at January 1, 2022 | 127 | 17 | (578) | 6 | 4,712 | 4,284 | 10 | 4,294 |
| Net income recognized in income statement | – | – | – | – | 561 | 561 | 4 | 565 |
| Other comprehensive income | ||||||||
| Cash flow hedges | – | – | – | (4) | – | (4) | – | (4) |
| Remeasurements on employee benefits | – | – | – | – | 152 | 152 | – | 152 |
| Foreign currency translation differences | – | – | (91) | – | – | (91) | – | (91) |
| Total other comprehensive income | – | – | (91) | (4) | 152 | 57 | – | 57 |
| Total comprehensive income | – | – | (91) | (4) | 713 | 618 | 4 | 622 |
| Dividend paid | – | – | – | – | (337) | (337) | – | (337) |
| Equity at December 31, 2022 | 127 | 17 | (669) | 2 | 5,088 | 4,565 | 14 | 4,579 |
Consolidated Cash Flow Statement
| in CHF million | ||
| 2022 | 2023 | |
| Operating result | 731 | 770 |
| Depreciation and amortization | 440 | 476 |
| Interest received | 5 | 12 |
| Interest paid | (51) | (39) |
| Income tax paid | (145) | (131) |
| (Increase)/decrease in inventories | (221) | 142 |
| (Increase)/decrease in trade receivables | (52) | (46) |
| (Increase)/decrease in finance lease receivables | (211) | (303) |
| Increase/(decrease) in trade payables | (2) | (19) |
| Increase/(decrease) in contract liabilities | 7 | (2) |
| Non-cash items | (50) | 25 |
| Change in other net operating assets | (22) | 49 |
| Cash flow from operating activities | 429 | 934 |
| Capital expenditure on intangible assets | (222) | (227) |
| Capital expenditure on property, plant and equipment | (223) | (224) |
| Acquisition of subsidiaries | – | (300) |
| (Increase)/decrease in financial investments | 159 | 44 |
| Disposal of intangible assets | – | 1 |
| Disposal of property, plant and equipment | 7 | 9 |
| Cash flow from investing activities | (279) | (697) |
| Proceeds from long-term borrowings | 3 | 59 |
| Repayment of long-term borrowings | (4) | (4) |
| Payment of lease liabilities | (138) | (134) |
| Proceeds from (repayment of) short-term borrowings | 71 | (89) |
| Proceeds from issuance of bonds | – | 249 |
| Repayment of bonds | – | (100) |
| Increase/(decrease) in liability to shareholder | – | 1 |
| Dividend paid | (337) | (281) |
| Cash flow from financing activities | (405) | (299) |
| Exchange differences | (18) | (43) |
| Total increase/(decrease) in cash and cash equivalents | (273) | (105) |
| Cash and cash equivalents at January 1 | 1,264 | 991 |
| Cash and cash equivalents at December 31 | 991 | 886 |
2023 Sales Growth
| Sales Growth | ||||
| financial amounts in CHF million | ||||
| 2022 | 2023 | Change in CHF (%) | Change in local currencies (%) | |
| Europe excl. Eastern Europe | 3,201 | 3,351 | 4.7 | 8.7 |
| Americas | 1,841 | 1,874 | 1.8 | 9.1 |
| Asia / Pacific | 763 | 791 | 3.7 | 13.8 |
| Eastern Europe / Middle East / Africa | 542 | 504 | (7.0) | 3.1 |
| Total Group | 6,347 | 6,520 | 2.7 | 9.0 |